This report reveals trends and insights in the developer community and is based on the responses of 24,534 people across the globe.
We share what matters most – from predictions on AGI, to our top programming languages, to the pets who wag, purr, and steal our hearts.


Is it an absent colon? An extraneous bracket? No, just some fun facts about our fellow developers.
Shuffle the deck to discover a new fact
nerd out with programming for fun as a main hobby.
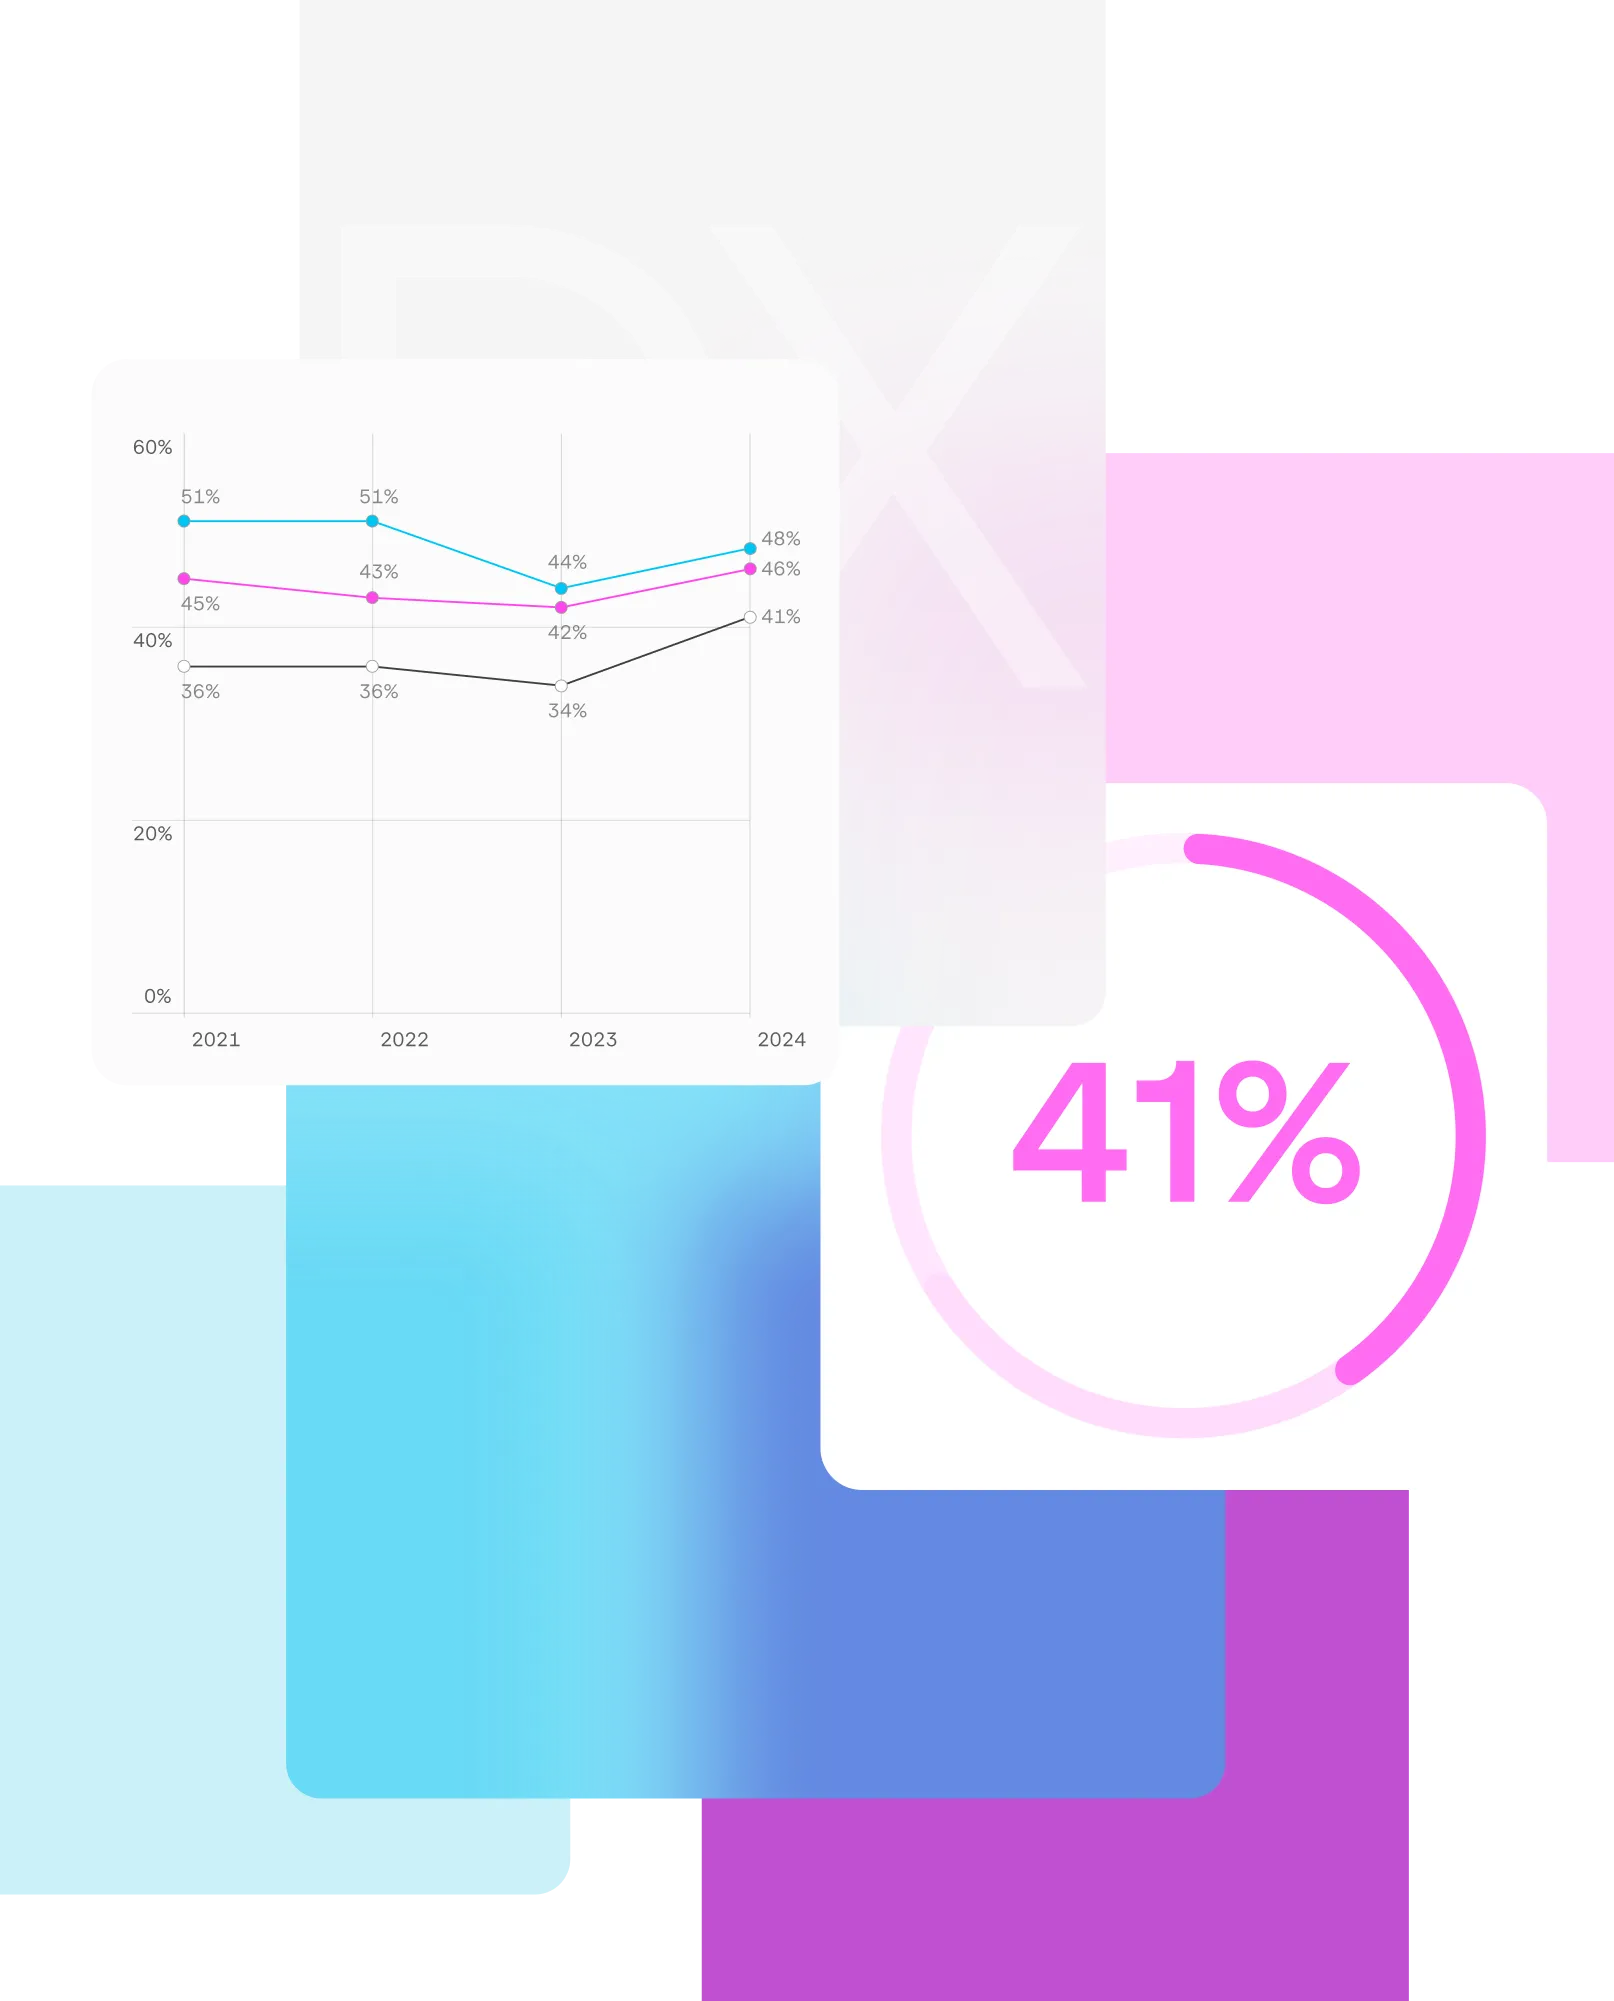
The State of Developer Experience and Developer Productivity
66% of developers don’t believe or aren’t sure that current metrics reflect their real contribution.
Instead, they consistently request greater transparency and clarity in measurement processes.
Get access to the full reportMethodology so well-weighted it makes yin and yang look uneven.
The survey ran from April to June, 2025, and included 24,534 developers after data cleaning. We balanced our responses by geography, employment, programming languages, and JetBrains product use.
Some bias may remain, as JetBrains users could have been more likely to respond.
Read the methodology
Want to dig into the results yourself? Download the anonymized survey responses and see what you discover!
Learn what the data reveals about tool satisfaction measurement